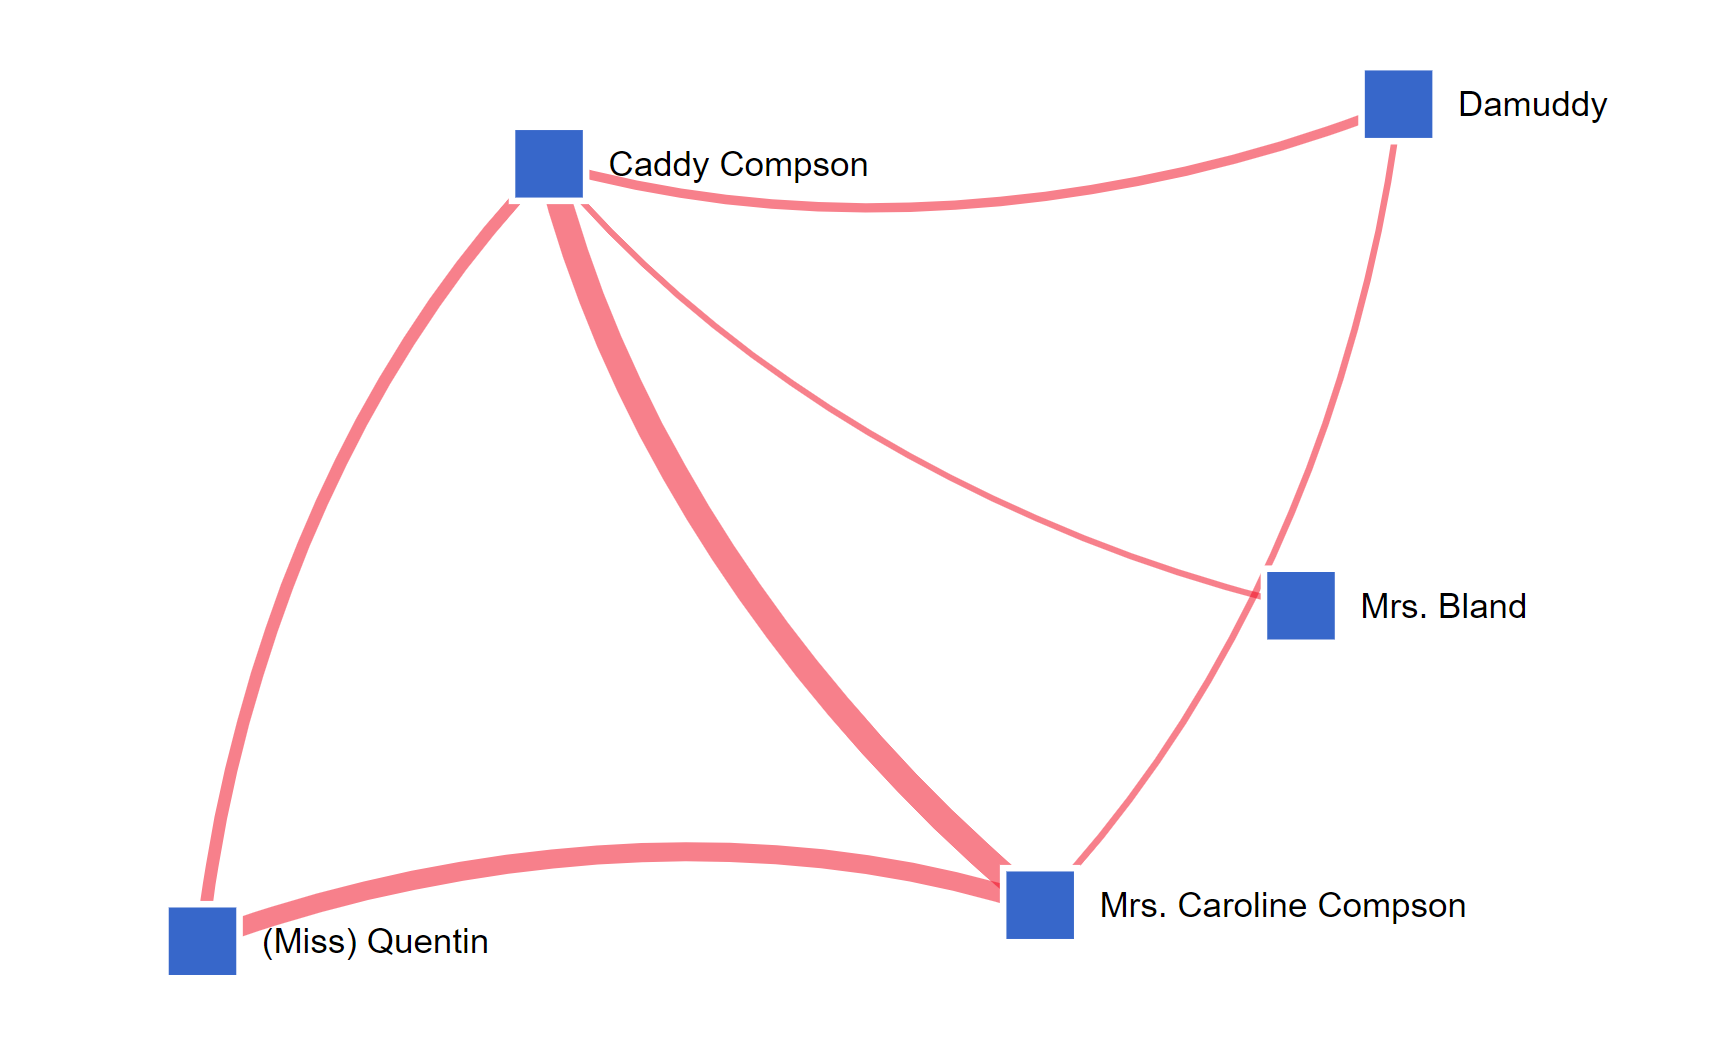
This graph shows how often characters are present or mentioned in the same event. A red line () between two blue boxes () shows at least one interaction, and a thicker line indicates multiple interactions. Characters with more connections are closer to the center, but, importantly, the position of characters are not fixed.
Characters who appear close together in one graph may appear far apart in another. The graph is interactive, so you can click on a character’s name to see their connections. You can also click and drag characters to reposition them.